Forecasting at scale: Managing risk across millions of merchants
Jerome Thai
At Parafin, we power embedded financing products for millions of merchants.1 Our partners entrust us with extensive historical sales data (over several years of daily transactions across more than one million merchants) providing a unique opportunity to build data-driven underwriting systems that align capital offers to the rhythm and scale of each merchant.
Sales forecasting lies at the heart of that process. A merchant’s past sales pattern tells us not just where they’ve been, but where they’re headed, and how we can responsibly extend capital that fuels their growth. However, building a reliable forecasting framework for merchants is far from trivial.
We faced three challenges:
- Managing risk and uncertainty in highly volatile sales data.
- Capturing complex seasonality across diverse industries.
- Forecasting at scale, with billions of data points across more than one million merchants to process, and tens of millions of forecasts to generate efficiently every day.1
Each challenge required a distinct solution, ultimately leading to a forecasting system that is risk-aware, adaptive, and computationally scalable. In this blog post, we focus on managing risk.
Managing risk through quantile regression
Traditional forecasting models predict a single point estimate: the “average” future sales. But merchant sales are inherently volatile, and the cost of forecasting error is asymmetric:
- Overestimating sales increases loss rates and can put undue repayment burden on a merchant.
- Underestimating sales leads to missed origination opportunities and reduced capital access.
Since the cost of overestimation is much greater than underestimation, we needed a way to model uncertainty explicitly and generate forecasts that reflect different levels of risk.
To achieve this, we implemented quantile regression with a scalable supervised learning approach well suited for structured tabular data. Quantile regression minimizes the pinball loss, which penalizes over- and underestimation asymmetrically. We generate forecasts across a grid of quantiles (10th–70th), and interpolate between quantiles for smooth predictions.
Hence, instead of predicting a single “average” value, the model estimates multiple conditional quantiles (e.g., 10th, 20th, 50th percentiles), providing a view of the full sales distribution rather than a single point estimate. This allows us to quantify uncertainty and tailor forecasts to different risk profiles: using lower quantiles for volatile merchants to limit overestimation risk.
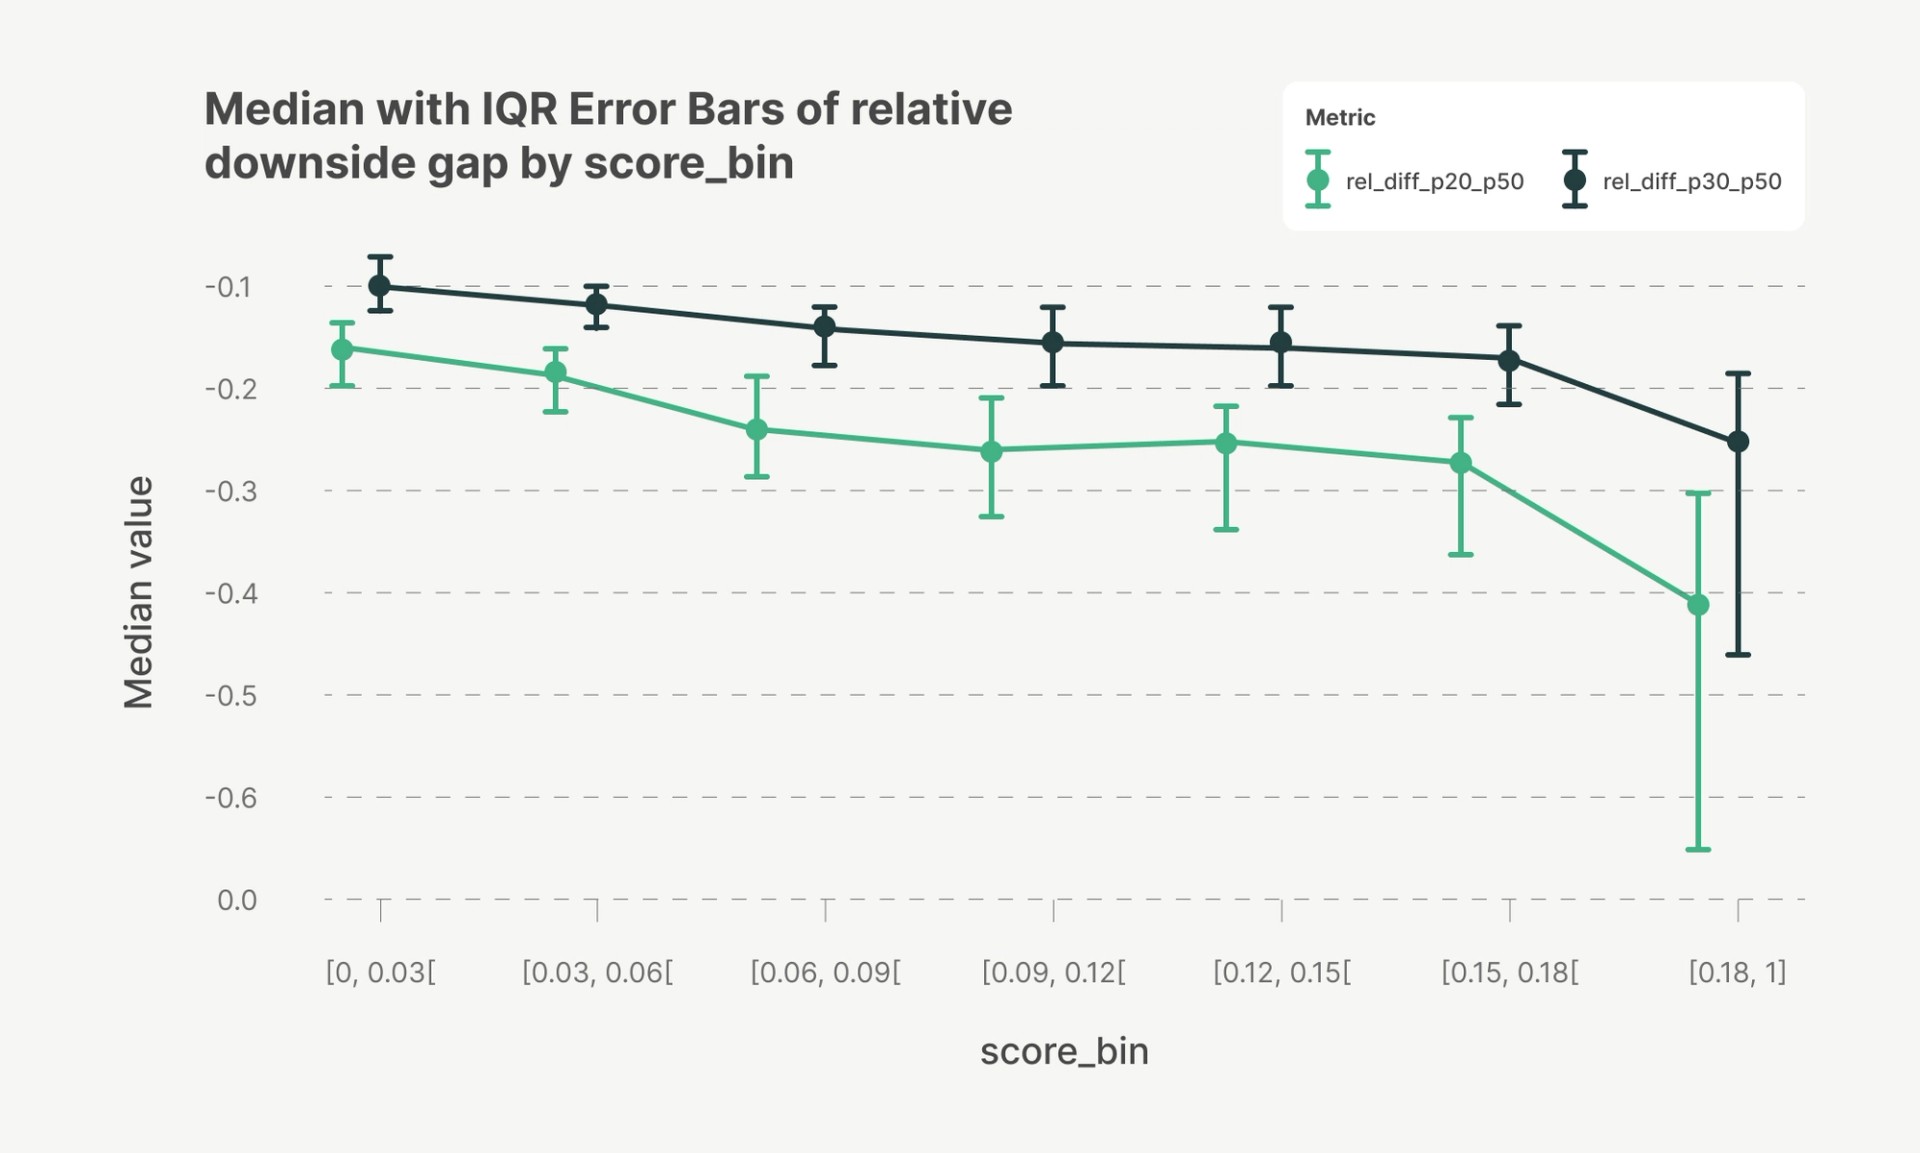
At Parafin, we also generate a risk score for each merchant, representing their probability of default. Analysis across one of our largest enterprise partners revealed that as merchant risk scores increase, lower quantile forecasts diverge increasingly from the median, for example, p20 falls much further below p50. This pattern indicates that the model’s predictive uncertainty scales appropriately with risk, confirming strong calibration and risk sensitivity.
At the same time, forecasting at this scale introduces significant computational challenges. With over one million merchants and years of daily sales data, our system processes billions of data points and tens of millions of forecasts each day. To scale efficiently without sacrificing accuracy, we prioritized approaches that balance throughput, stability, and operational simplicity in production. This factors into our underwriting approach to analyze thousands of data points like revenue history, cash flow, and debt load to decide if a business is health enough to fund. We detailed our approach to building the most accurate underwriting platform for SMBs in a recent article.
Decision making with quantile predictions
Quantile regression provides a structured framework for incorporating risk directly into forecasting. Because the model already widens its uncertainty band for riskier merchants, there is no need to manually adjust quantiles downward by risk score, assuming the risk model itself is accurate and well-calibrated. Instead, we can adopt a uniform conservative quantile, such as the 40th percentile (p40), across the partner’s portfolio to prevent oversizing and concentration risk. The chosen quantile is empirically calibrated using backtesting plots to ensure that forecasts overestimate sales by, e.g., more than 33% in fewer than 10% of cases, maintaining a controlled level of forecast optimism.
We formalize offer sizing as an optimization problem that maximizes total potential origination while maintaining portfolio-level losses below 4%. Additional constraints cap offers below the 40th quantile prediction. Formally:
Linearizing the loss constraint yields:
This linear program has a greedy optimal solution. Its formulation corresponds to a continuous knapsack problem, where each merchant contributes one value per unit exposure xi (their offer size) and incurs a “cost” proportional to its excess loss probability (pi − 0.04) (where pi is their probability of default):
- Merchants with pi < 0.04 generate “budget” by lowering portfolio risk; they receive the highest allowable offers.
- Merchants with pi > 0.04 consume budget; offers to these merchants are reduced or eliminated once the loss constraint binds.
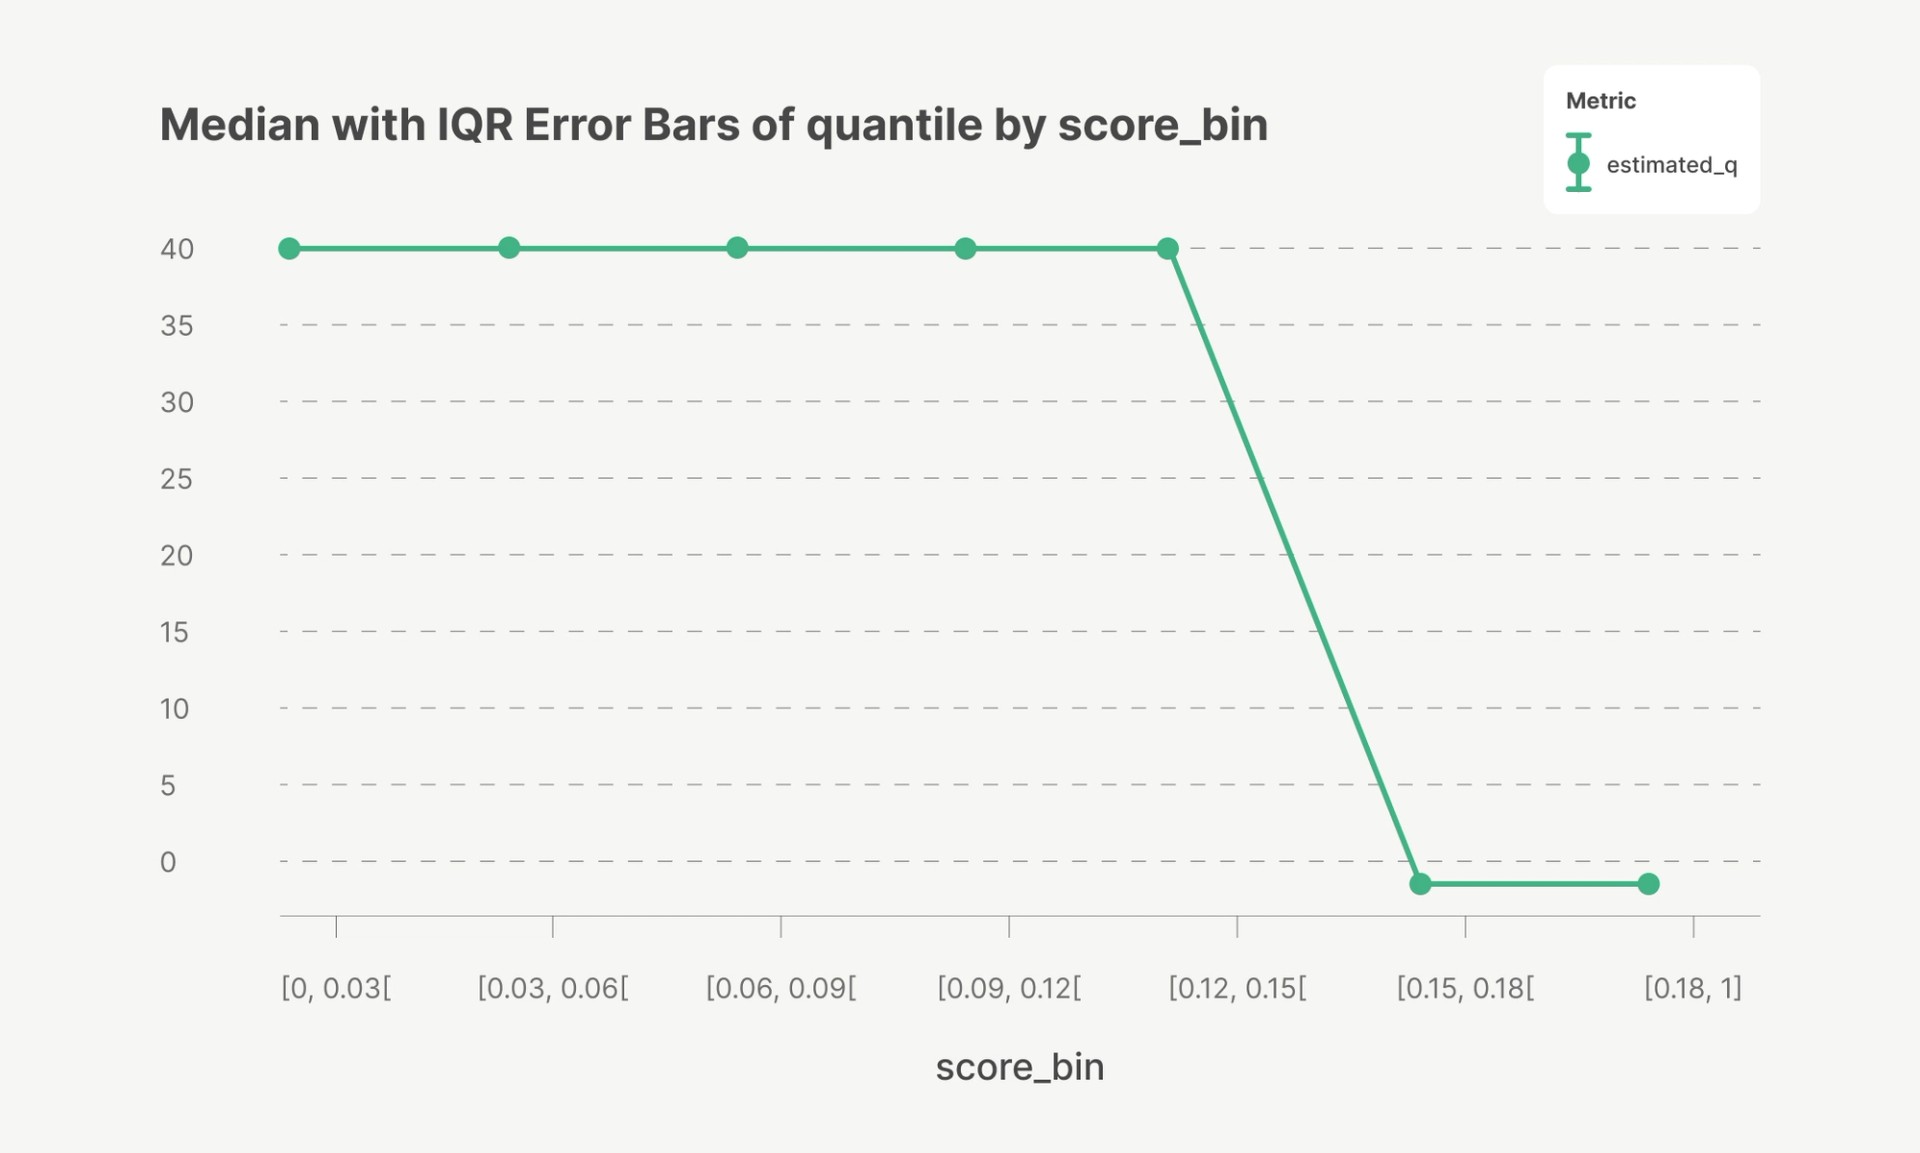
When applied to a sample of over 500,000 businesses from our enterprise partner dataset, this optimization yields a consistent allocation pattern: the optimal forecast quantiles correspond to a uniform quantile at p40 across risk score bins, up to a 0.15 threshold where the portfolio’s loss budget is exhausted. Beyond this cutoff, offers are no longer extended. In effect, quantile regression achieves efficient capital allocation without requiring risk-dependent quantile adjustments.
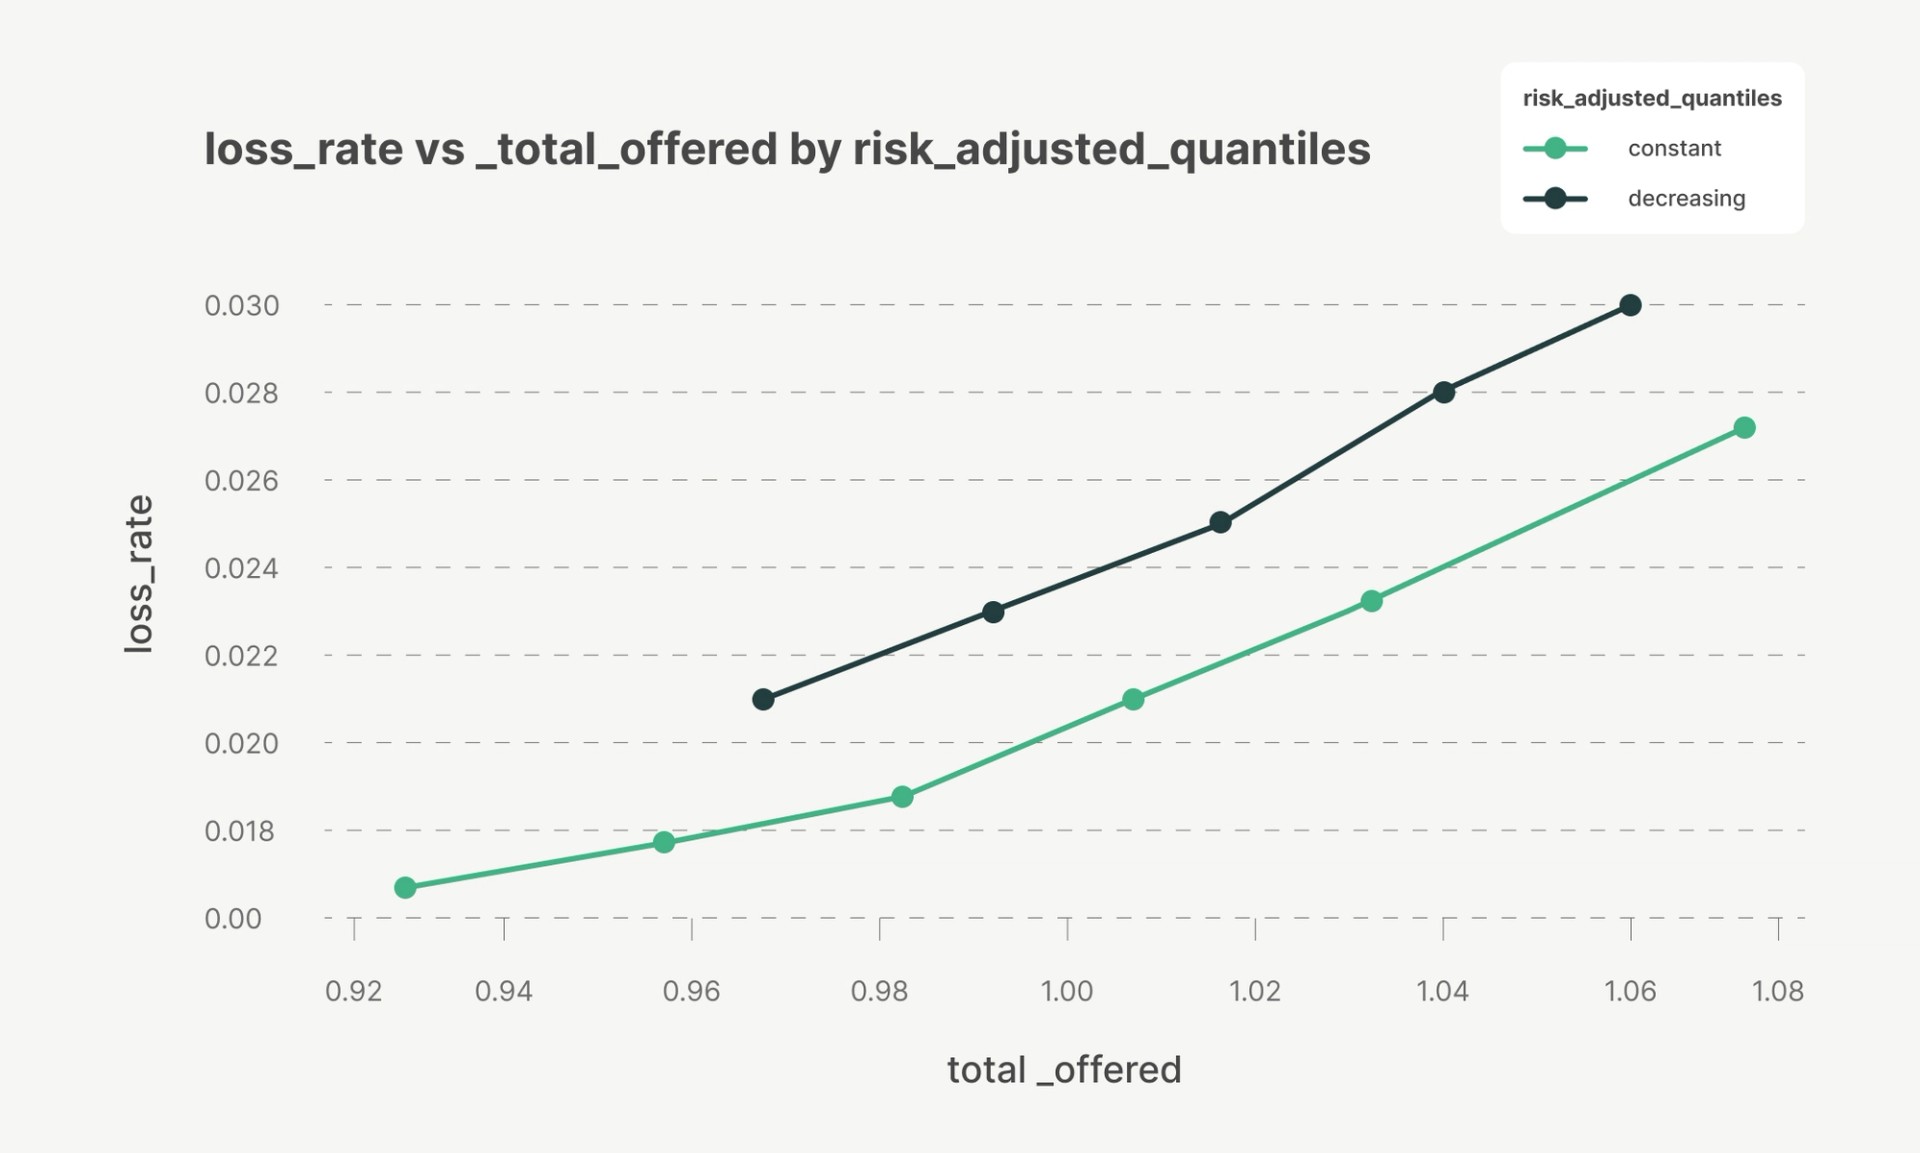
Backtesting on historical sales data further validates this approach. When tracing Pareto frontiers on realized merchant outcomes, portfolios using uniform quantiles up to a risk cutoff achieve higher revenue at equivalent loss rates than those using quantiles that decrease linearly with risk. This demonstrates that quantile regression naturally provides both risk alignment and capital efficiency without manual adjustments.
Risk-based quantile tapering
This analysis assumes our loss probability estimates are exact. In practice, these estimates become less certain as risk increases. We introduce additional conservatism for medium-risk merchants by tapering offers earlier (before the 0.15 risk score cutoff) using downward, risk-based quantile adjustments. This behavior can be justified using the Bertsimas–Sim budgeted robustness framework. While our risk model is well-calibrated on average, risk estimation uncertainty increases near and beyond the eligibility boundary due to limited loss data and higher variance in the high-risk segment. We model this by allowing each merchant’s true probability of loss to exceed its point estimate by a bounded amount,
where the uncertainty radius deltai usually increases with risk score. Rather than assuming all merchants simultaneously realize worst-case losses p̂i+δi, we constrain aggregate misspecification via an uncertainty budget,
Under this formulation, increasing exposure to merchants with higher uncertainty consumes this budget more quickly, making it optimal to gradually reduce offers before the expected-loss constraint (0.04 in the above example) fully binds. Operationally, it is similar to risk-based quantile tapering:
- Well inside the safe region (low p̂i, low δi): offers remain at the cap bi, as both expected loss and estimation uncertainty are small.
- Approaching the eligibility boundary (higher p̂i, higher δi): offers begin to decline smoothly, reflecting the rising cost of allocating capital to merchants whose risk is both higher and less precisely estimated.
- Beyond the cutoff: offers drop to zero once the combined expected-loss and uncertainty budgets are exhausted.
As a result, the optimal allocation exhibits a smooth taper near the cutoff rather than an abrupt stop, reflecting prudent diversification through risk-based quantile tapering.
Key takeaway
Quantile regression reframes forecasting as a distributional modeling problem, capturing uncertainty in future sales rather than relying on a single point estimate. Separately, risk estimates themselves are subject to calibration error and increased variance in higher-risk segments. By coupling sales quantile predictions with a robustness-aware capital allocation framework that explicitly accounts for uncertainty in risk estimates, Parafin integrates both sources of uncertainty directly into its decisioning pipeline. In effect, capital is allocated not only based on expected sales distributions and risk, but also on the reliability of the underlying risk predictions. This design enables scalable, data-driven control of portfolio loss and offer sizing while remaining resilient to estimation error.
Join us
The forecasting and risk models described here power Parafin's embedded capital platform. If you're building a platform and want to offer financing to your merchants, learn how Parafin can help.
We're also growing our engineering, product, and data science teams. If you're interested in tackling complex challenges in machine learning, payments, or compliance, explore our open roles.
1 Based on internal Parafin analysis of small businesses through January 2026.